The scripts are written in a modular
fashion, processing one earthquake
for one station at a time. There are several accompanying wrapper
and plotting scripts that can be used to display the results and
calculate statistics from processing many earthquakes per station.
1) Extract waveforms containing surface wave arrival from db or other
into ascii file t,z,n,e (css_wfextract.pl)
---------------------------------------------------------------------------------
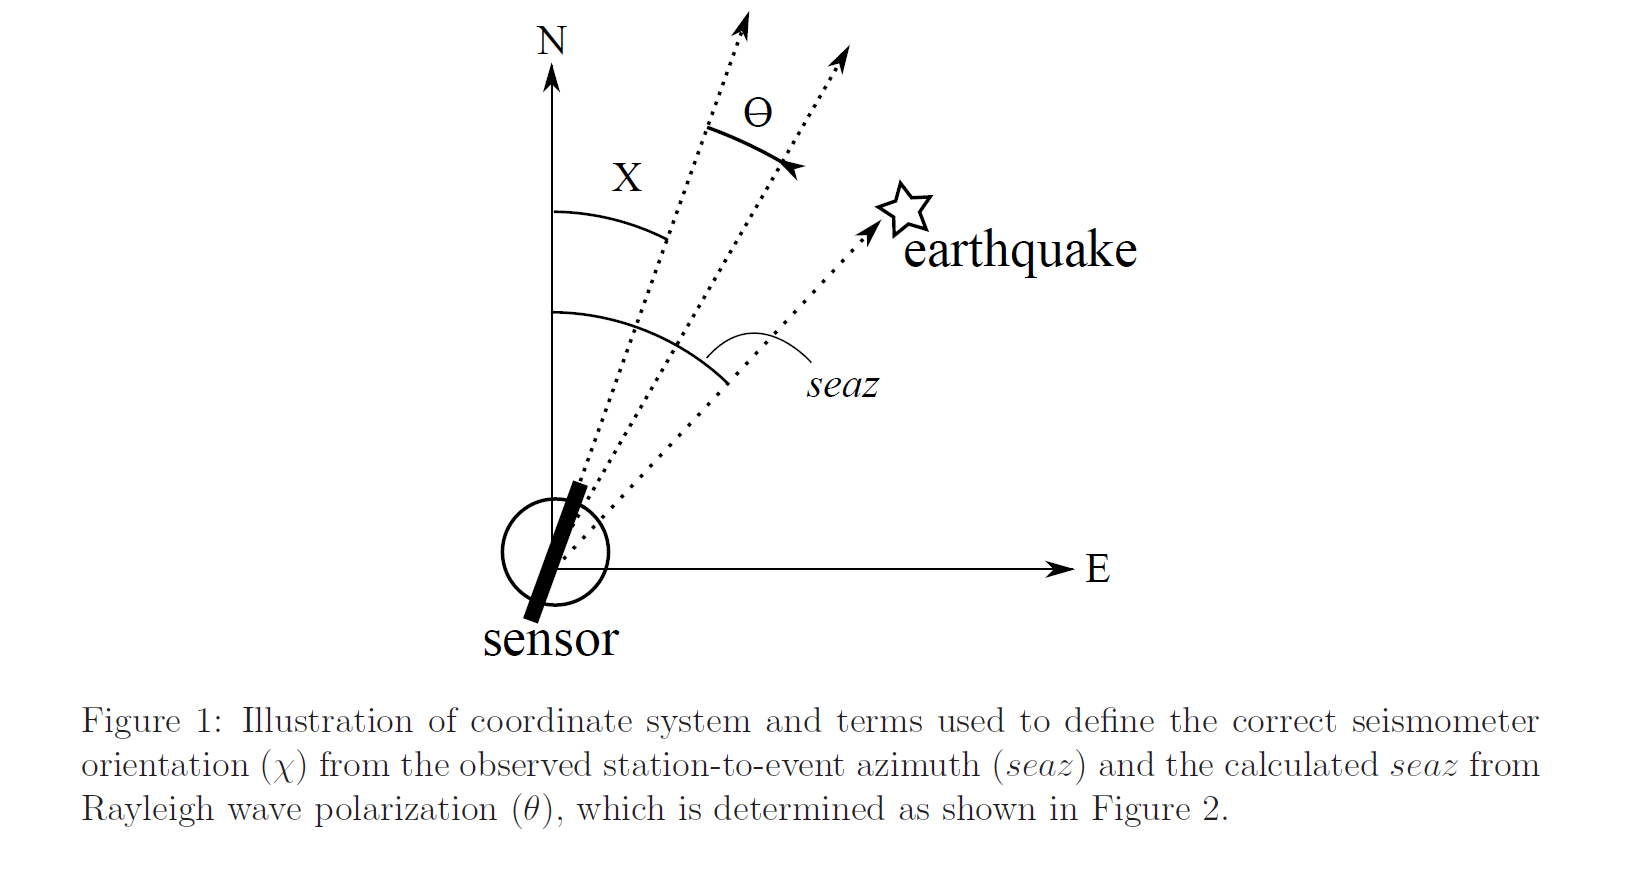
2) Run CSpolar.pl to determine azimuth (between 0 and 360) for highest
correlation between Hilbert transformed vertical component and radial
component (computed from two horizontal components and assumed
azimuth). Output of CSpolar is a file of time, azimuth, Szz, Szr,
Srr, Czr, Czr2.
Time: Not used
Azimuth: 0-360
Szz: Zero lag amplitude of ZZ xcorr (see paper)
Szr:
Srr:
Czr: Value from Eq.2
Czr2: Value from Eq. 3


