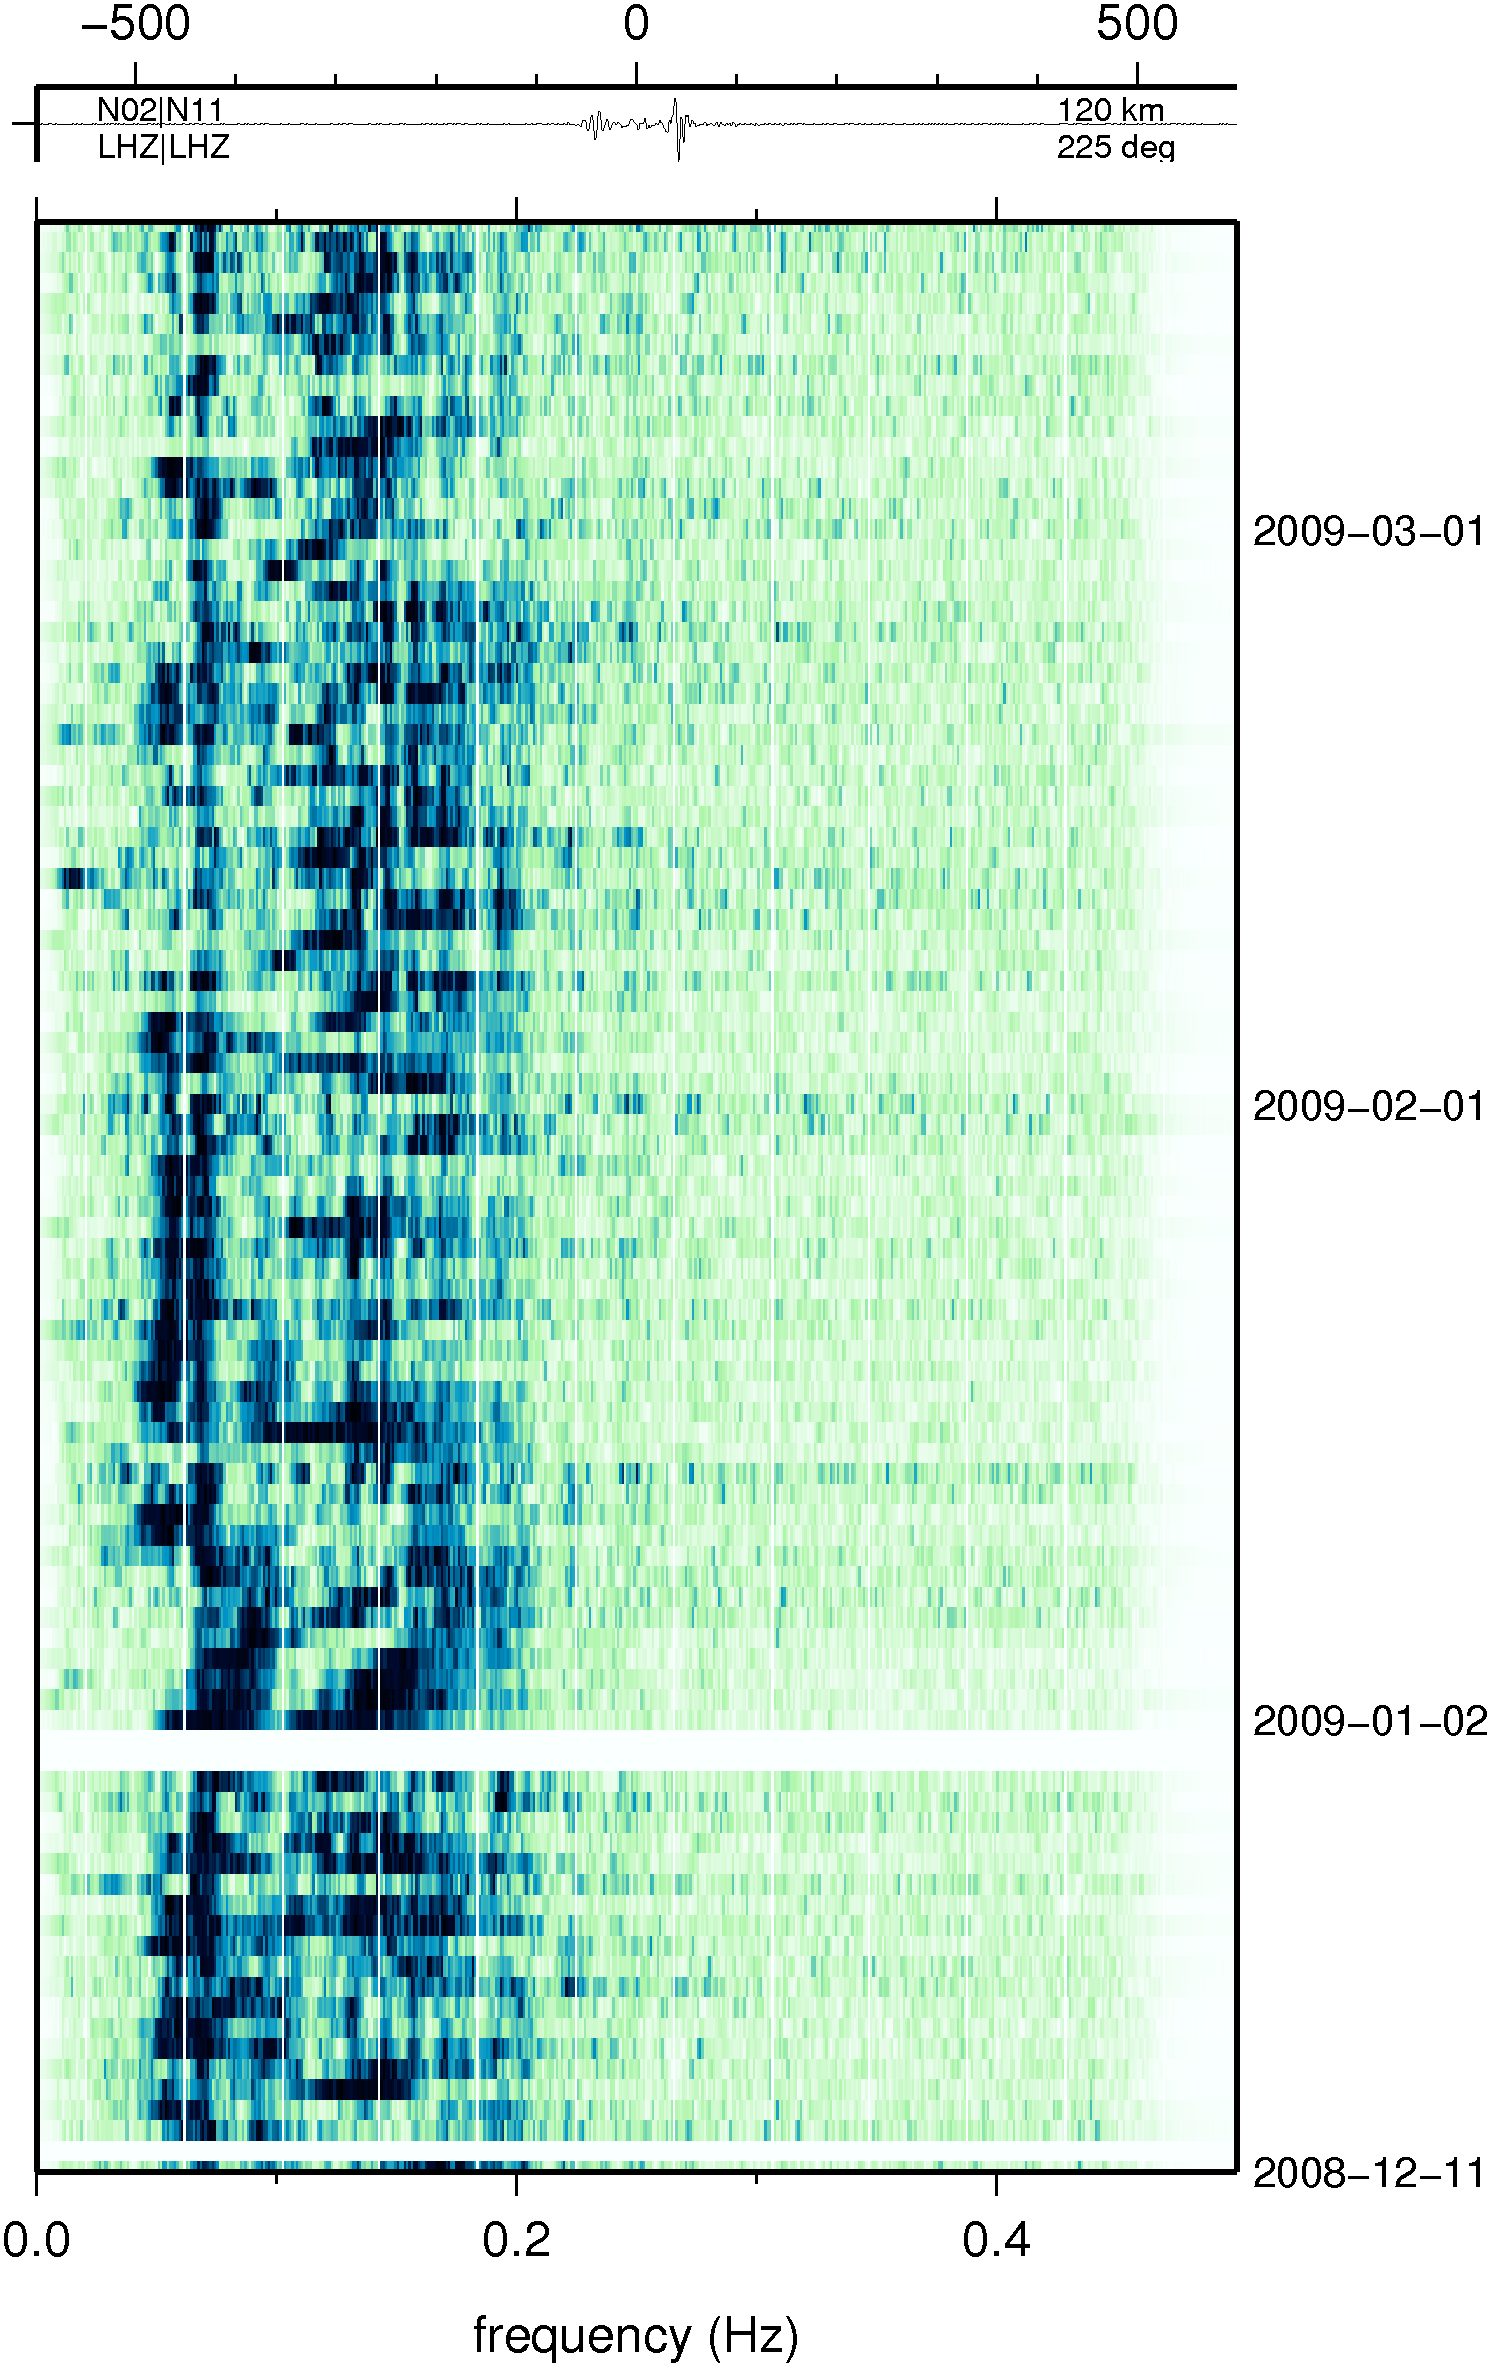
Spectral amplitude variations over time. Each horizontal slice shows the FFT of a daylong cross
correlation stack. The cumulative cross correlation function is show at the top of each
image along with the interstation distance in kilometers and the azimuth from station 1 to
station 2.
The raw data have a sample rate of 1 sample per second.
Station pair N02-N11, separated by 120 km, with an azimuth from N02 to N11 of 225 degrees.
Download a PDF of the unfiltered daystack spectral amplitude images
here (18.3MB)